
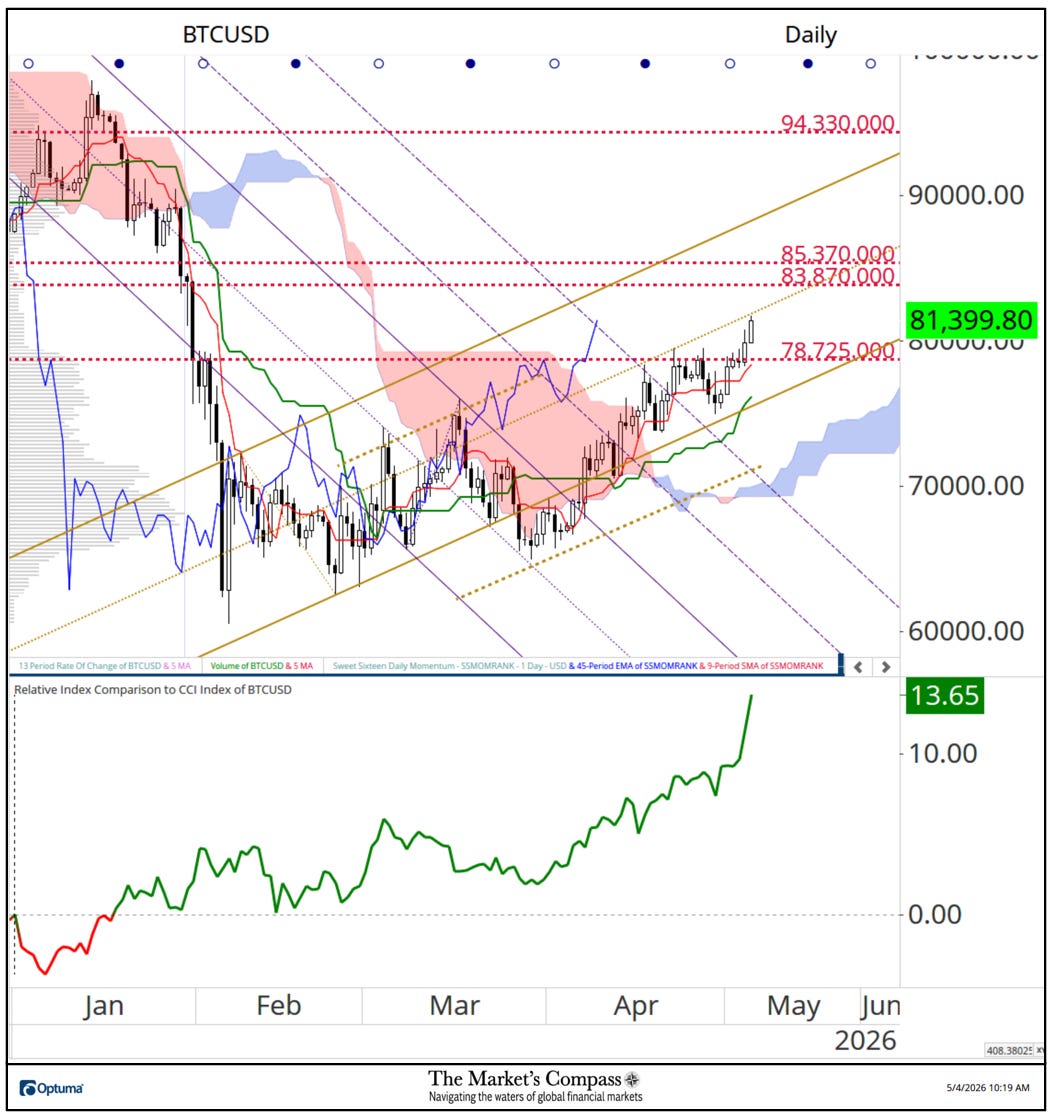
The Daily Bitcoin chart shows the bona fide breakout above price resistance on Sunday, and today’s follow-through to just under the Median Line (gold dotted line) of the Schiff Modified Pitchfork. The Lagging Line, which is the current price (close) shifted back 26 bars (blue line), held support at the Median Line twice and moved out of the Cloud in early April signaling the upcoming trend change. The panel below the price chart is a line chart of the Relative Index Comparison of Bitcoin vs. the broader CCi30 Index*. Aside from a brief spell of weakness in the first half of January Bitcoin has since outperformed the broader index by 13.65%.
Will my head be “chopped off” and is this a false breakout? The current technical evidence suggests no. Only a drop back below 78,725.00 and a pullback that falls back below the lower parallel and Kijun Plot (green line) would suggest that this technical thesis is overly bullish.
*The CCi30 Index is a registered trademark and was created and is maintained by an independent team of mathematicians, quants and fund managers lead by Igor Rivin. It is a rules-based index designed to objectively measure the overall growth, daily and long-term movement of the blockchain sector. It does so by indexing the 30 largest cryptocurrencies by market capitalization, excluding stable coins (more details can be found at CCi30.com).
For readers who are unfamiliar with the technical terms or tools referred to in the comments on the technical condition of the CCi30 Index can avail themselves of a brief tutorial titled, Tools of Technical Analysis available on my website.
Charts are courtesy of Optuma whose charting software allows the Technical Rankings to be calculated and back tested.
To receive a 30-day trial of Optuma charting software go to…


